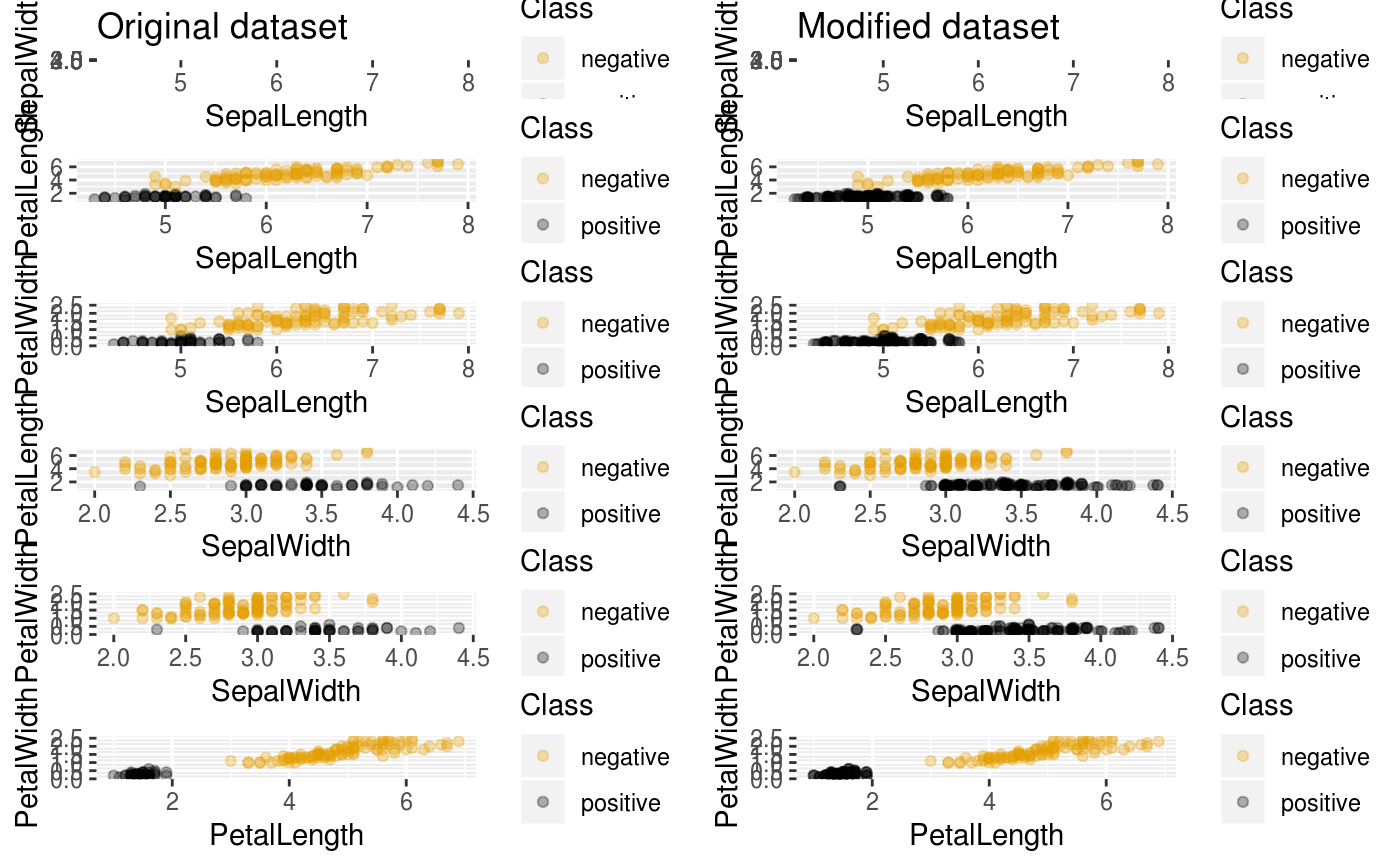
Plots comparison between the original and the new balanced dataset.
Source:R/utils.R
plotComparison.RdIt plots a grid of one to one variable comparison, placing the former dataset graphics next to the balanced one, for each pair of attributes.
plotComparison(dataset, anotherDataset, attrs, cols = 2, classAttr = "Class")
Arguments
| dataset | A |
|---|---|
| anotherDataset | A |
| attrs | Vector of |
| cols | Integer. It indicates the number of columns of resulting grid. Must be an even number. By default, 2. |
| classAttr |
|
Value
Plot of 2D comparison between the variables.
Examples
data(iris0)
set.seed(12345)

rwoSamples <- rwo(iris0, numInstances = 100)
rwoBalanced <- rbind(iris0, rwoSamples)
plotComparison(iris0, rwoBalanced, names(iris0), cols = 2, classAttr = "Class")
